Space Between Money and the Planet
The opportunity cost for using batteries to reduce carbon emissions.
This study proposes the existence of a tradeoff between monetary gain and carbon emissions reduction in the dispatch of electric batteries for arbitrage.
Supporting materials for this work are in adgefficiency/space-between-money-and-the-planet.

A focus on economic profit is demonstrated to not result in maximum carbon savings. A focus only on wholesale prices often removes the entire carbon benefit and leads to a carbon emissions increase.
A calculation of the breakeven carbon price necessary to remove the tradeoff between prices and carbon is performed. This carbon price represents the price needed to align the world where we optimize for monetary gain with the world where we prioritize carbon reduction.
The calculation of the breakeven carbon price provides an estimate of the market correction required to reconcile the conflicting objectives of financial and environmental performance in the dispatch of electric batteries for arbitrage.
Motivation
The importance of battery storage
Battery storage is a key technology of the clean energy transition. Batteries enable low carbon, intermittent renewable generation to replace dirty electricity.
Batteries pose a different set of control problems than other key energy transition technologies like solar or wind.
A battery makes decisions to charge or discharge based on an imperfect view of the world, with competing objectives and value streams.
Once a wind turbine or solar panel is built, operating that asset is straightforward - you generate as much as you can based on the amount of wind or sun available at that moment. There is no decision to make or opportunity cost to trade off - when the resource is available, you use as much as possible.
Arbitrage of money and carbon
A common battery operation stragety is arbitrage - the movement of electricity between periods of high and low value.
In the price arbitrage scenario, a battery wants to purchase cheap electricity and sell it at a higher price. A battery that does the opposite, that charges when electricity prices are high and discharges when they are low, will lose money.
A battery that charges with dirty electricity and discharges when electricity is clean increases carbon emissions. Charging increases the load on a dirtier generator, while discharging decreases the load on a cleaner generator.
Tradeoff between profit maximization and emissions minimization
Operating a battery requires making decisions to achieve a goal. Two natural goals for a battery are to maximize profit or save carbon.
A central point of this work is that we cannot rely only on optimization driven only by price signals to maximize carbon savings.
This view was shared in 2022 by The Economist:
Many funds claim that there is no trade-off between maximising profits and green investing, which seems unlikely for as long as the externalities created by polluting firms are legal and untaxed.
The ‘just make money’ fallacy
In my career I’ve personally held and often encountered the following perspective:
Environmentally effective climate action must be economically effective - we need to make money in order to save the planet.
It’s often backed up with the view that renewables are low variable cost generators, able to bid into electricity markets at lower prices than high variable cost generators (like gas and coal).
This viewpoint (and viewpoints similar to it) are convenient - just make money, ignore the carbon side and you are also saving the planet.
Methods
Experiment source code is here.
Experiment design
- Join raw price and carbon intensity data.
- Simulate battery with objectives of: a. profit maximization, b. carbon emissions minimization,
- Compare the economic and carbon benefits of the two objective.
Re-run the experiment
Requires Python 3.10+ - the command make results will re-run the entire experiment including downloading & joining the raw data and running the simulations for price and carbon objectives:
$ git clone https://github.com/ADGEfficiency/space-between
$ cd space-between
$ make results
Signals and worlds
The key idea in the methodology is to take the difference between two worlds - a world where we optimize for money, and a world where we optimize for price.
In an ideal world, we would be able to operate a battery to both make money and save carbon at the same time. If clean electricity is cheap and dirty electricity is expensive, we can operate our battery to make money, and know that we will also be saving carbon.
In the opposite world, where dirty electricity is cheap and clean electricity is expensive, there is an opportunity cost to saving carbon. There would be situations where you would need to reduce the environmental benefit of operating your battery in order to make more money.
Below is a scenario where there is an opportunity cost to saving carbon. We can measure the delta between these two worlds in terms of the two things we care about - money and carbon.
Choosing to prioritize money over carbon means we make $150 more than if we optimized for carbon, but we generate 10 tC more than if we optimized for carbon:
| Optimize for Money | Optimize for Carbon | Delta | |
|---|---|---|---|
| Money saved $ | 200 | 50 | 150 |
| Carbon saved tC | 10 | 20 | 10 |
| Carbon Price $/tC | 15 |
Looking at the delta between our two worlds allows us to calculate a carbon price of 15 $/tC. This carbon price is the ratio of money gained by optimizing for money to the carbon saving gained by optimizing for carbon.
We would be giving the market $150 to balance out what we lose when optimizing for carbon, and receive 10 tC of carbon savings in for our lost money.
This carbon price would be applied in proportion to the carbon intensity of the electricity produced by each market participant.
This price estimates the level of support (via a revenue neutral carbon tax on electricity market participants - of course!) required to counteract the misalignment between the price and carbon signals and worlds.
Data
This study uses data from the Australian National Electricity Market (NEM) from 2014 to end of 2022.
This experiment uses two signals as input interval data - a price signal and a carbon signal.
The price signal is the 5 minute dispatch prices in South Australia. This is a slightly different dataset than the trading price. Dispatch prices were chosen so that the prices (before and after the transition from 30 to 5 minute trading price settlement) is on the same frequency (5 minutes per interval) as the carbon intensity data.
The carbon signal is the 5 minute NEMDE data and NEM generator carbon intensity in South Australia. The NEMDE dataset has data on the marginal carbon generators, which allows calculation of a marginal carbon intensity.
Dependencies
The main third-party Python dependencies of this work are pandas for data processing, matplotlib for plotting and pulp for linear program solving.
This work depends on nem-data - a Python CLI for downloading Australian electricity market data:
import nemdata

data = nemdata.download(start="2020-01", end="2020-02", table="trading-price")
This work depends on energy-py-linear - a Python library for optimizing the dispatch of energy assets for profit maximization and carbon emissions reduction:
import energypylinear as epl

#  2.0 MW, 4.0 MWh battery
asset = epl.battery.Battery(power_mw=2, capacity_mwh=4, efficiency=1.0)

results = asset.optimize(
  electricity_prices=[100.0, 50, 200, -100, 0, 200, 100, -100], freq_mins=5
)
Battery model
The battery model is a mixed-integer linear program built in PuLP. It optimizes the charge and discharge of a battery with perfect foresight of future prices and marginal carbon intensities. The roundtrip efficiency of the battery is set at 100%.
The only value stream available to the battery is the arbitrage of electricity or carbon from one interval to another. The battery is optimized in monthly blocks with interval data on a 5 minute frequency.
Results
Download previously generated results with Python 3 using make pulls3:
$ git clone https://github.com/ADGEfficiency/space-between
$ cd space-between
$ make pulls3
This pull previously generated results from S3 using the AWS CLI into ./data:
$ tree -L 3 ./data
├── database.sqlite
├── dataset.parquet
└── results
    ├── 08cdcee2-a315-49d8-9207-820a5ad4a0de
    │   ├── input-interval-data.parquet
    │   ├── interval-data.parquet
    │   ├── meta.json
    │   └── simulation.parquet
    ├── 0bd87681-d422-491c-9ad2-3afc1503ab6f
    │   ├── input-interval-data.parquet
    │   ├── interval-data.parquet
    │   ├── meta.json
    │   └── simulation.parquet
    ...
    └── fab33244-fc60-456a-8377-f5f73c2700d7
        ├── input-interval-data.parquet
        ├── interval-data.parquet
        ├── meta.json
        └── simulation.parquet
Optimize for price or carbon
The battery model was optimized on one of two objectives - either price or carbon.
Optimizing for price means the battery will import electricity from the grid at low prices and export it during high prices, leading to an economic saving.
Optimizing for carbon means the battery will import electricity from the grid at low marginal carbon intensity and export it during high marginal carbon intensity, leading to a carbon saving.
Below we compare the optimization of battery for these two objectives - the left optimizes a battery for money, on the right optimizing a battery for carbon:
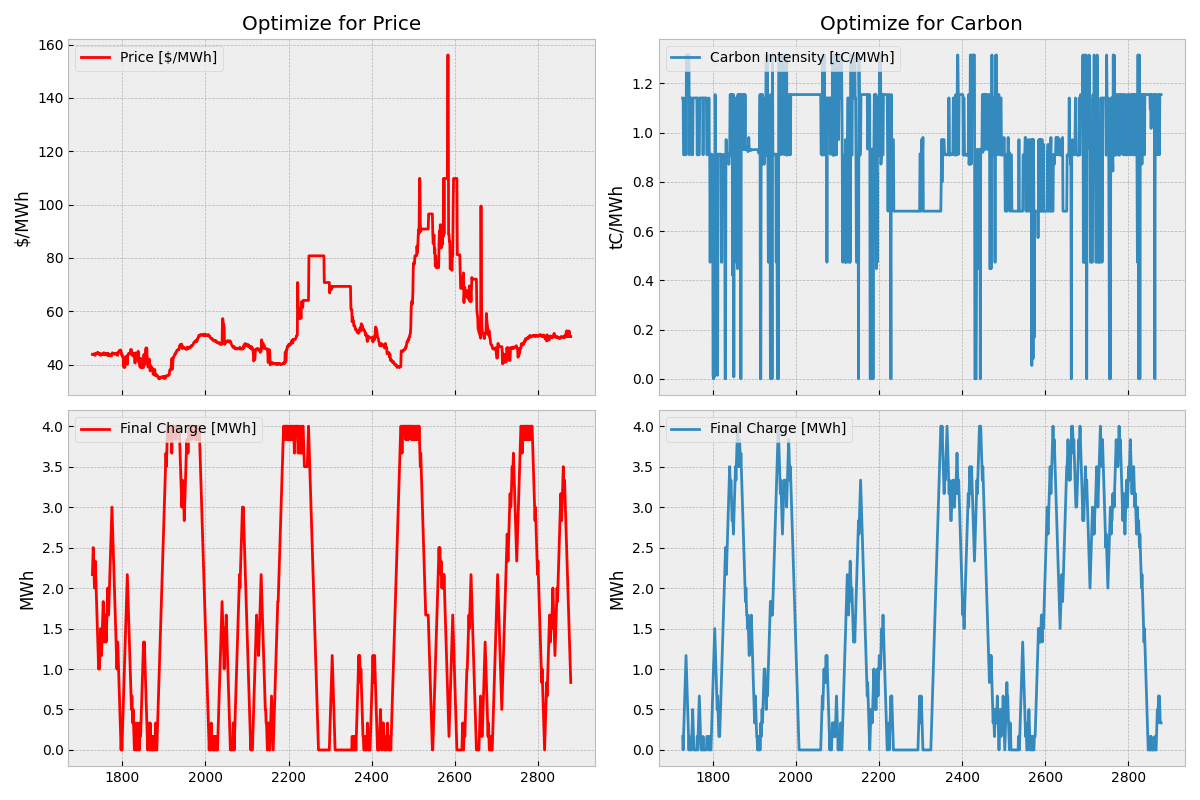
We can observe the full use of the battery charge in both the price and carbon arbitrage simulations.
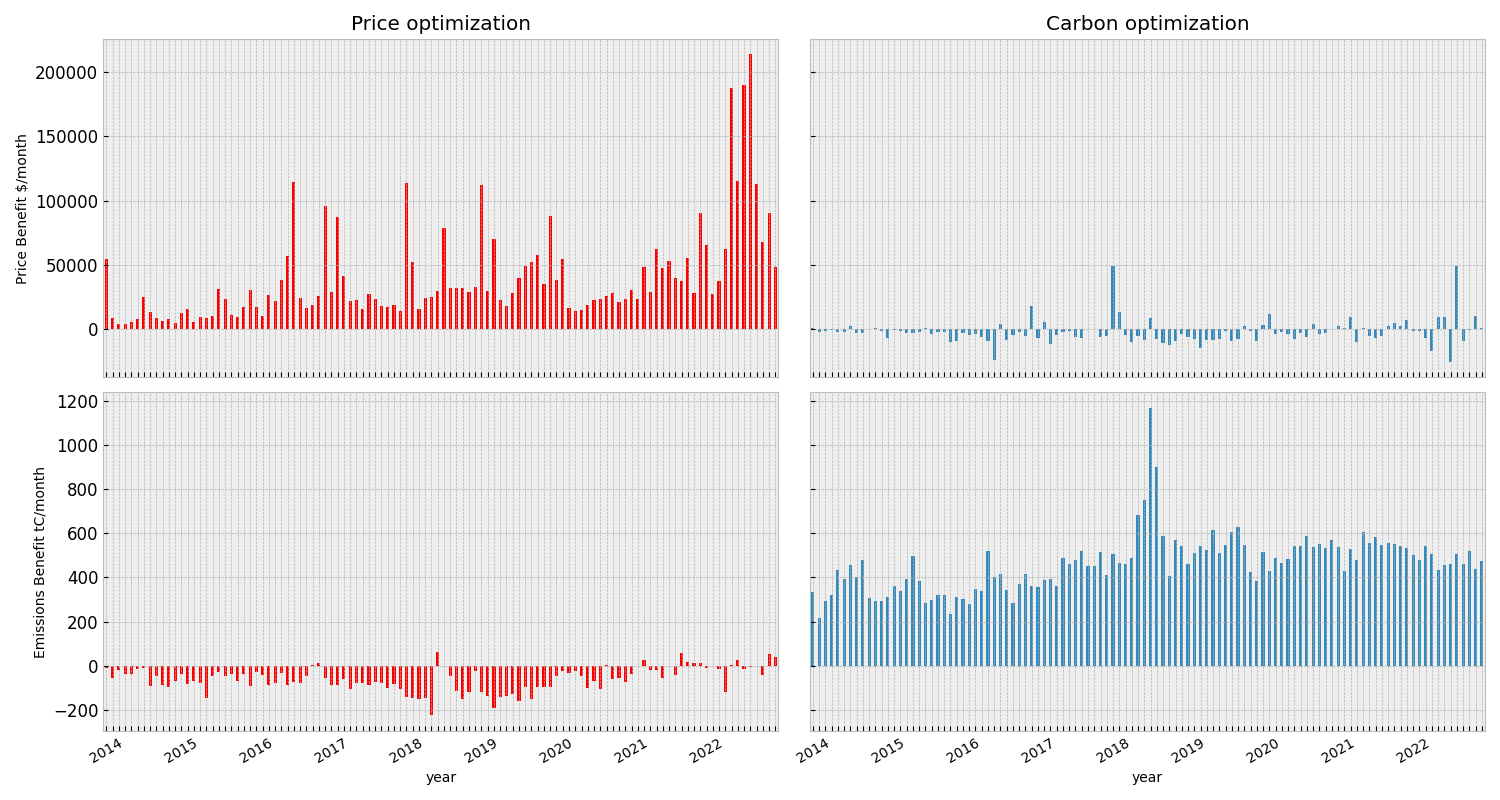
Monthly profit and emissions benefits
We can look at how our simulations are performing across the entire experiment by grouping our simulations by month.
A negative benefit is a loss. Negative profit means losing money, negative carbon benefit means increasing carbon emissions.
The chart below shows the price & carbon benefit from optimizing our battery for price and carbon for each month:
The table below summarize the data across the entire experiment:
| objective | negative_profit | negative_emissions_benefit | months |
|---|---|---|---|
| carbon | 73.1481 | 0 | 108 |
| price | 0 | 87.037 | 108 |
When we optimize for money, we have a negative effect on the environment 87% of the time. When we optimize for carbon, we will lose money 84.5% of the time.
These results are dramatic - changing our objective can often completely remove the benefit we see for the alternate objective.
Monthly carbon price
What we are interested in is how these two simulations change together - by taking the difference between the two simulations (one for money, the other for carbon), we can measure how far the space is between them.
The chart below shows the data grouped by month, but this time only shows the delta between our two worlds:
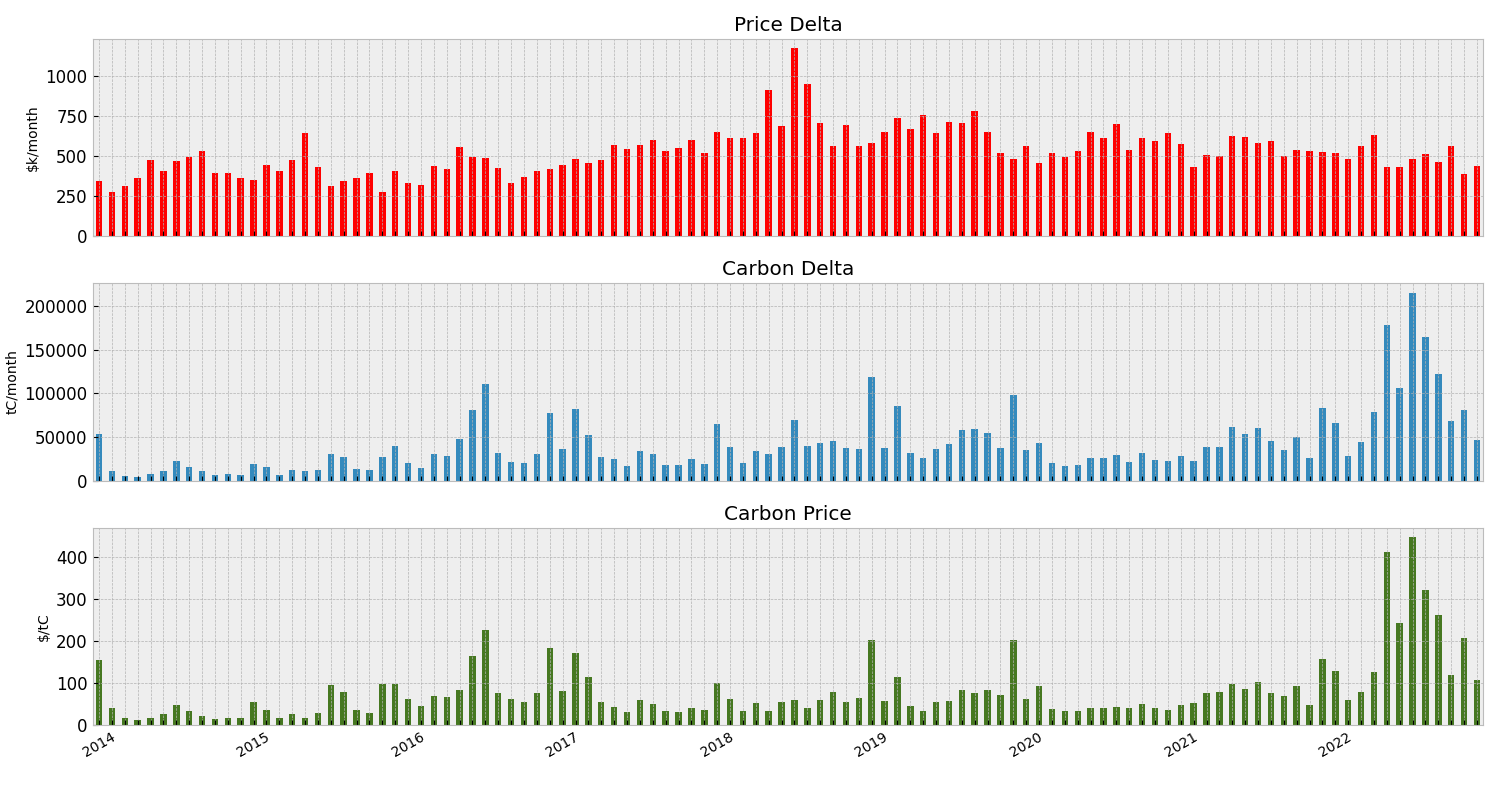
The three deltas shown above are:
- price delta - the difference between the optimize for money and optimize for carbon worlds in thousands of Australian dollars per month,
- carbon delta - the difference between the optimize for money and optimize for carbon worlds in term of tons of carbon savings per month,
- monthly carbon price - the ratio of our price to carbon deltas.
Annual carbon price
The final chart shows the delta between worlds results grouped by year:
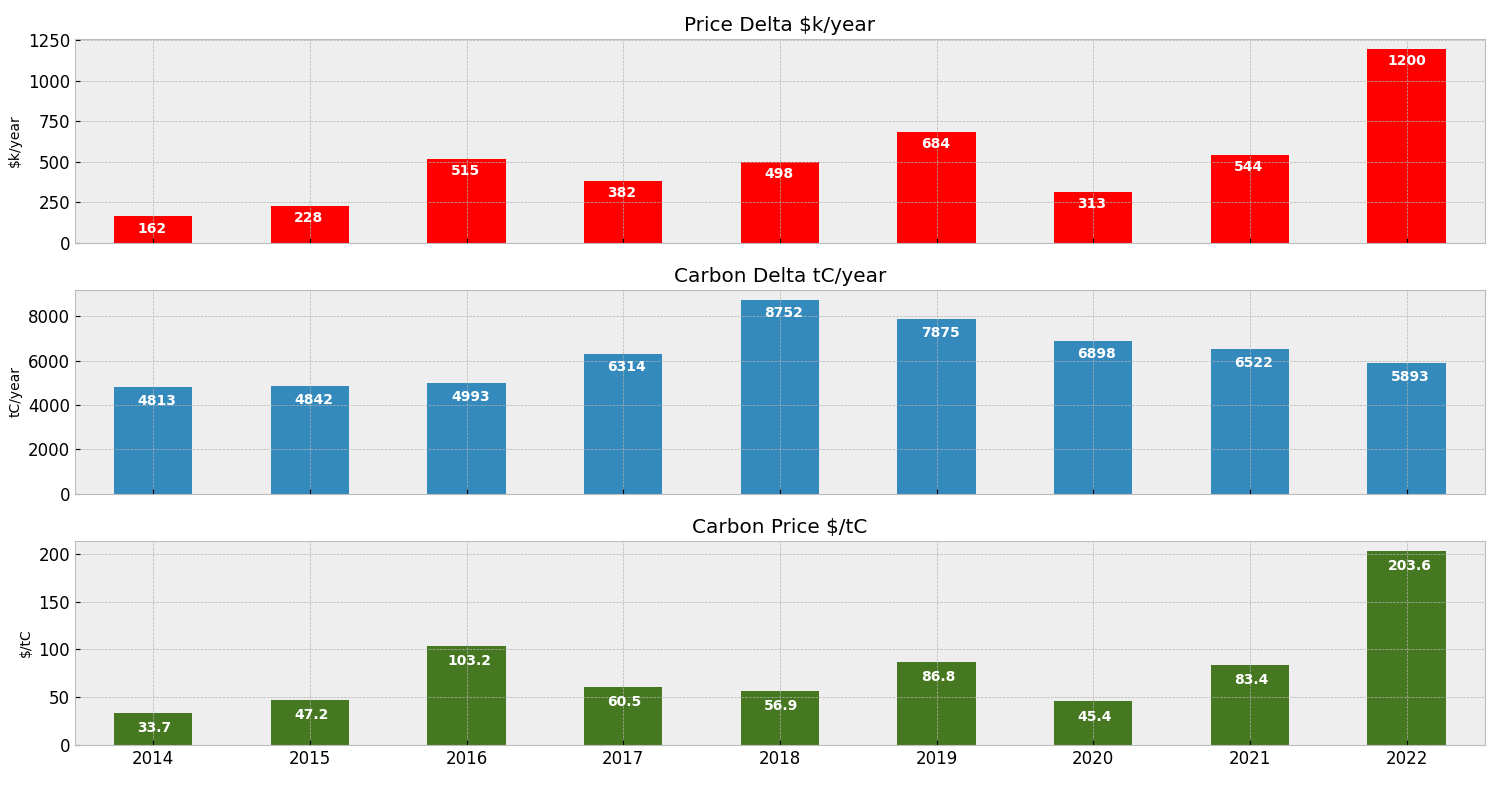
We can observe a few things from the chart above:
- a carbon price of below
80 $/tCwould fully correct for the misalignment between price and carbon signals in all years except 2022, - 2022 is an outlier due to both an increased price delta (meaning the electricity market was more valuable for batteries) and a lower carbon delta (due to cleaner electricity).
Discussion
Exploring carbon prices
A key result of this work is the estimation of the breakeven carbon intensity between our two simulated worlds.
A system where our deltas are $500 and 50 tC results in a carbon price of $/tC 10.
This carbon prices implies that if we adjust our market by collecting this $500 through a carbon price applied to all generation, we could incentivize lower carbon generation to be more competitive at the margin.
This carbon price is a break-even carbon price for the battery - it is what we would have to pay the market to offset the lost revenue of $500.
More Output Metrics
This study stops with the calculation of a carbon delta, which is reducing over time. This means that even if the carbon price was increasing, the total cost may be decreasing. The total cost is the carbon delta multiplied by the breakeven carbon price.
Effect of efficiency & forecast error on carbon price
The optimization done in this work is with perfect foresight. Optimizing with perfect foresight allows us to put an upper limit on both money and carbon savings. In reality, a battery will be operated with imperfect foresight of future prices.
Because we are interested in the ratio between carbon & economic savings, taking the ratio of maximum carbon to maximum economic savings is hopefully useful. The assumption is that the relative dispatch error (in % lost carbon or money) is the same for both objectives.
Data
This study uses the 5 minute South Australia dispatch price and the 5 minute NEMDE data for a carbon signal.
Using different price and carbon signals will change the results of this study - this isn’t a fatal criticism but it should reinforce that this study is heavily dependent on the choice of data.
We can add to this the generic but always relevant criticism of anything empirical - you can’t use the past to predict the future.
Marginal versus average carbon intensity
The intensity from the NEMDE data is a marginal intensity, supplied by the NEMDE solver as the slack variable for increasing demand. By using this signal we are assuming that any actions we took would not change how the market is dispatched - this will be true up to a point (the size of the marginal bid).
The marginal carbon intensity is different from the more commonly reported average carbon intensity. It would be interesting to compare these results with different carbon signals.
It does introduce the question of which intensity is relevant for the accounting.
Battery model
The battery model applies a constant roundtrip efficiency onto battery export - in reality efficiency is a non-linear function of state of charge, battery age and temperature.
This study uses a battery configuration of 2 MW power rating with 4 MWh of capacity - other batteries have different ratios of power to energy.
Single value stream
Batteries often have access to many value streams, such as network charge savings or grid frequency services. This experiment only considers the arbitrage of wholesale electricity.
Including other value streams will change the size of the delta between our two worlds.
Thanks for reading!
If you enjoyed the content of post, check out Measuring Forecast Quality using Linear Programming, which uses a linear programming battery model to measure the quality of a forecast.
If you enjoyed the style of this post, check out Typical Year Forecasting of Electricity Prices , which shows how to create a low variance forecasts and estimates of energy project performance.
Supporting materials for this work are in adgefficiency/space-between-money-and-the-planet.
@article{green2023spacebetween,
  title   = "The Space Between Money and the Planet",
  author  = "Green, Adam Derek",
  journal = "adgefficiency.github.io",
  year    = "2023",
  url     = "https://adgefficiency.com/space-between-money-and-the-planet/"
}