2017 BP Energy Outlook
BP’s view on the next 40 years.
I look forward to the Annual BP Energy Outlook. Two of the principles of the Outlook are:
- avoiding groupthink by exposing ideas to the public
- understanding uncertainty by generation of what-if scenarios
Below I highlight BP’s view on passenger cars and the effect of climate policies on natural gas over the course of the Outlook (2015-2035). The material for this post comes from the CSIS 2017 BP Energy Outlook Youtube video.
Oil consumption for passenger cars
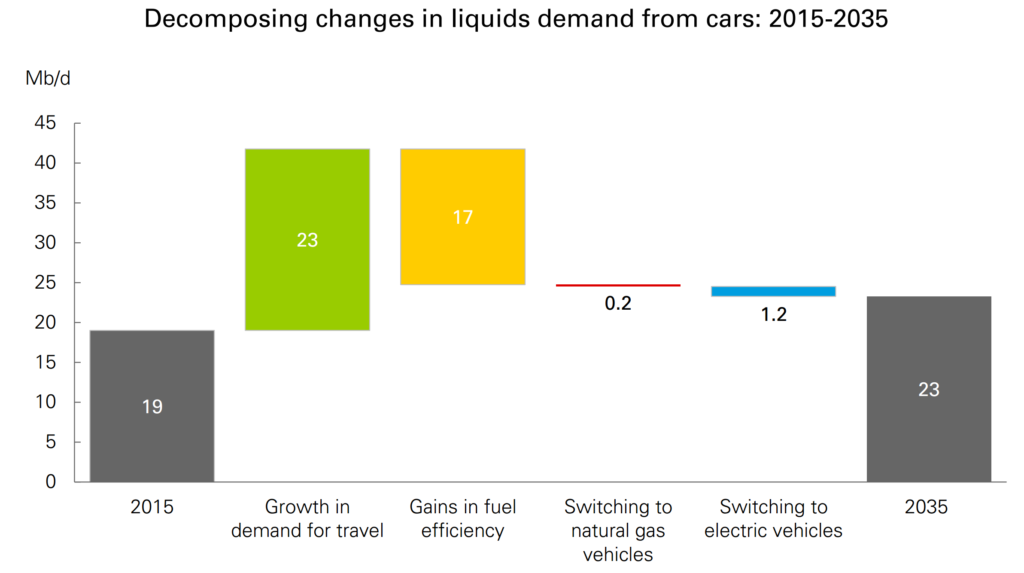 Figure 1 – Net change in car oil consumption
BP project that the continued emergence of the middle class will lead to a doubling of the global passenger car fleet.
The increased oil consumption associated with this doubling is almost entirely offset by a 2.5% annual improvement in fuel efficiency.
This fuel efficiency assumption seems quite small – but actually it is a strong break with the past. The average for the last twenty years is only 1%. Even small improvements in fuel efficiency have a large effect on oil consumption due to the size of the combustion engine fleet.
The opposite is true with electric cars. BP are projecting the number of electric cars increasing from 1.2 million to 100 million. This is a compounded annual growth rate of around 25%!
Unlike with fuel efficiency this relative increase has very little effect. Electric car deployment increasing by 100 times leads to only a 6% reduction versus 2015 oil consumption.
Electric cars are a sexy topic that gets a lot of media attention – yet vehicle fuel efficiency may be more important if we care about climate change.
Large relative increases can be dwarfed by small relative increases. It’s important to take everything back to the absolute value (in this case oil consumption) that we care about.
Risks to gas demand
Oil majors and energy professionals are both interested in the future of natural gas. In the Outlook BP take a look at how climate policy could affect the growth of natural gas.
Strong climate policies pose a risk to all fossil fuels – natural gas included. Strong climate policies lead to the reduction of all fossil fuels in favour of low carbon energy generation.
However the Outlook shows that actually both strong and weak climate policies pose risks to natural gas consumption.
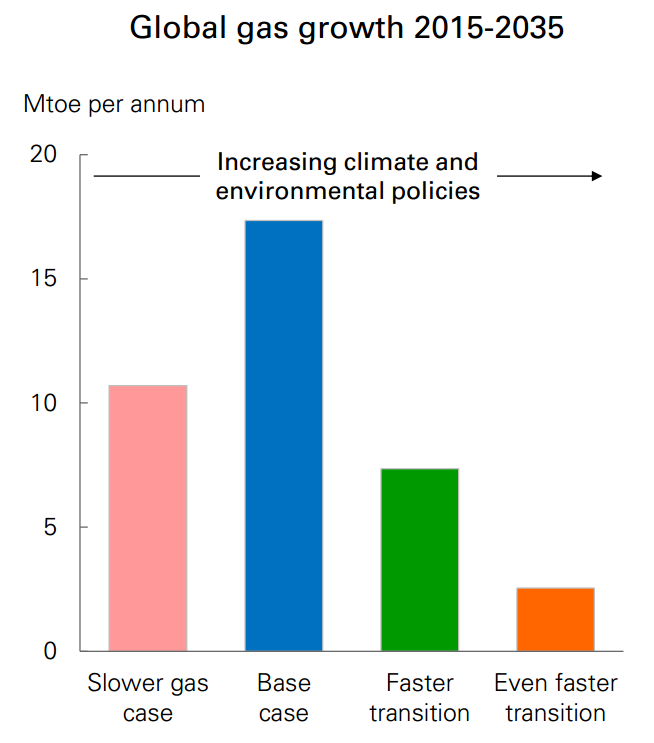 Figure 2 – The effect of climate policy strength on natural gas consumption growth
Weak climate policies will favour fossil fuels but also benefit coal over natural gas. BP expect the net effect of this would be a reduction in gas growth versus their base case.
This is quite a nice example of a Laffer curve. The Laffer curve is traditionally used for demonstrating the relationship between tax revenue and the tax rate. The curve shows there is an optimum somewhere in the middle.
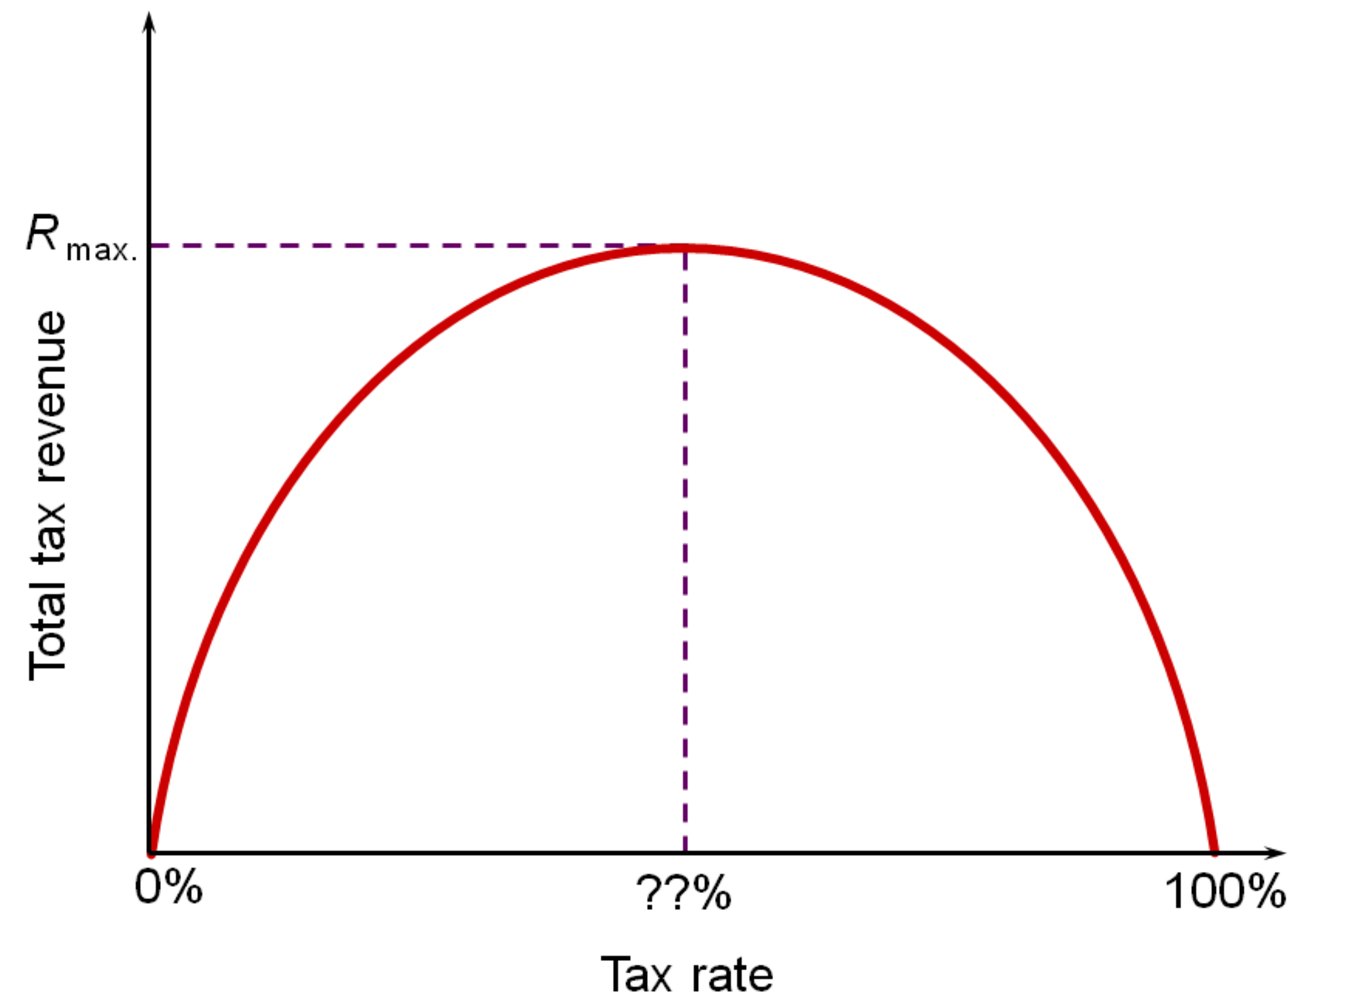 Figure 3 – The Laffer Curve
BP are showing that natural gas consumption likely follows a Laffer curve with respect to climate policy.
Thanks for reading!