A simple guide to data provided by AEMO for the Australia's National Electricity Market (NEM).
This is a short guide to the electricity grid & market data supplied by the Australian Energy Market Operator (AEMO) for the Australian National Electricity Market (NEM).
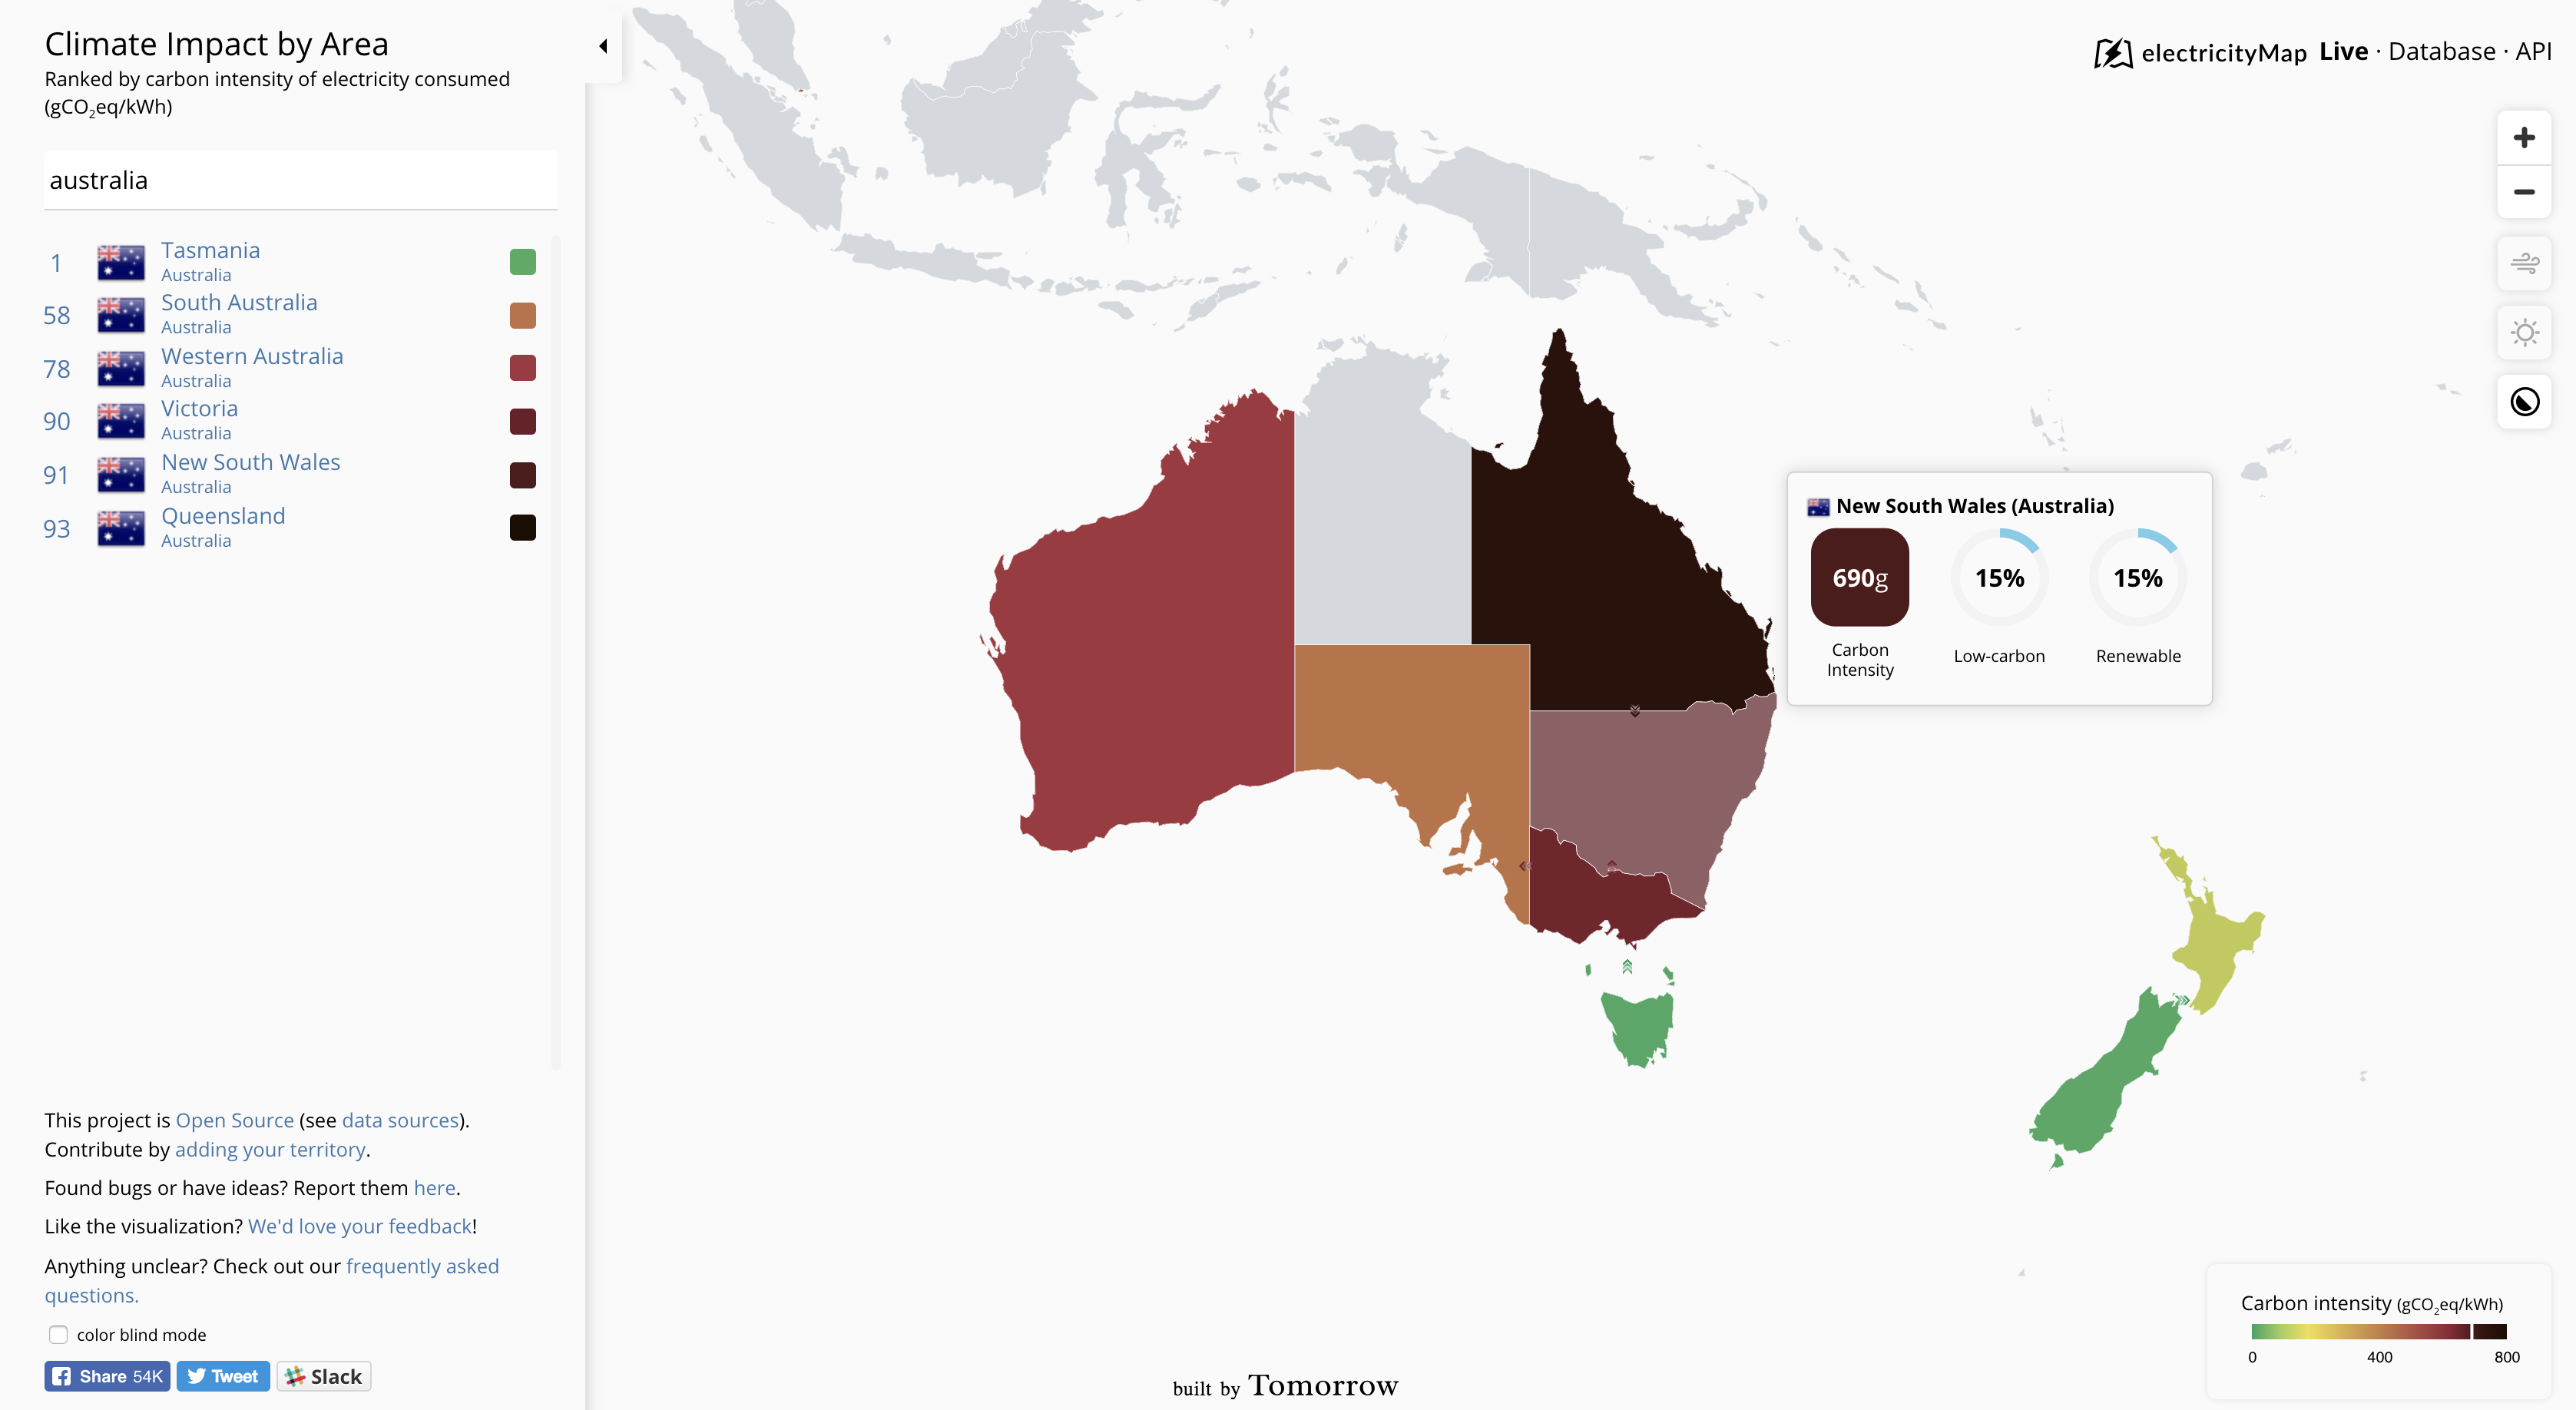
The NEM is Australia’s electricity grid in Queensland, New South Wales, Victoria, South Australia, and Tasmania.
Market participant information in the NEM is given in the NEM Registration and Exemption List:

The carbon intensities for generators are given in the Available Generators CDEII file:
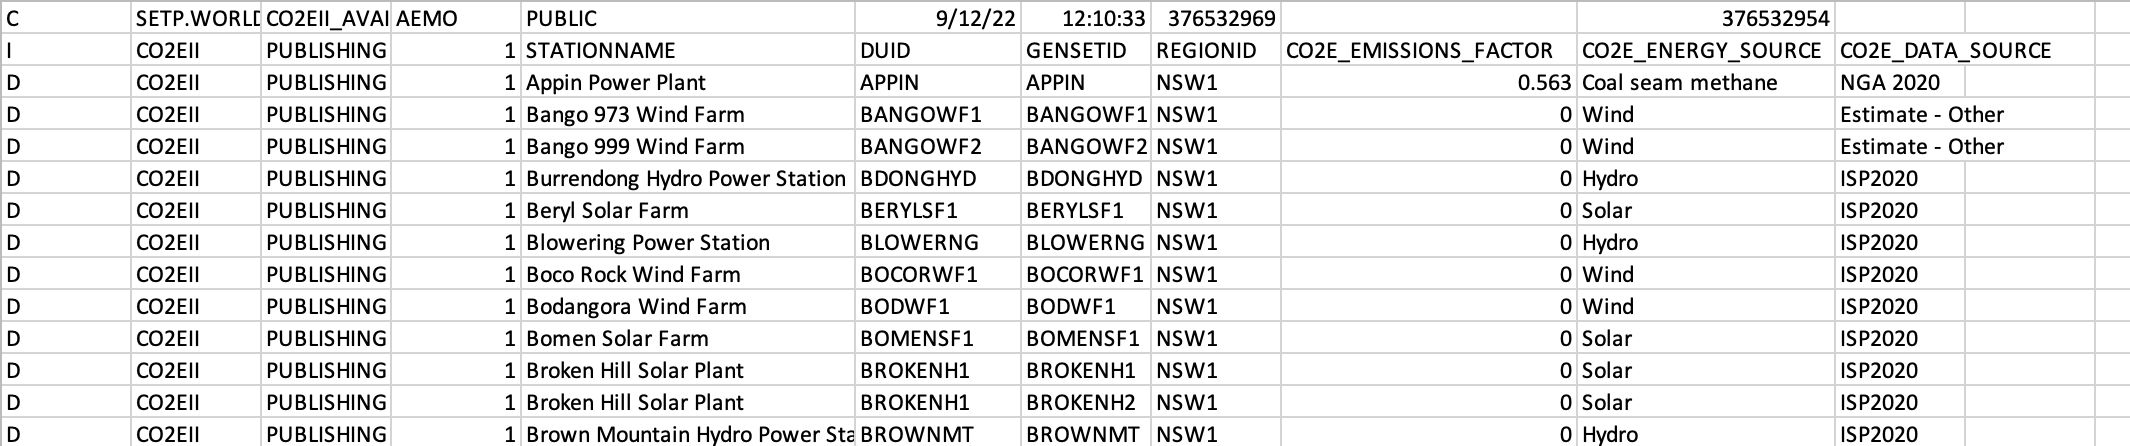
Both of these files are linked by a Dispatchable Unit Identifier (DUID), which identifies a generating unit.
Interval data for the NEM is provided in two sources the NEM Dispatch Engine (NEMDE) and the Market Management System Data Model (MMSDM).
The NEMDE dataset provides information about how the grid is dispatched and price are set (including information about the marginal generator) in the NemPriceSetter XML files.
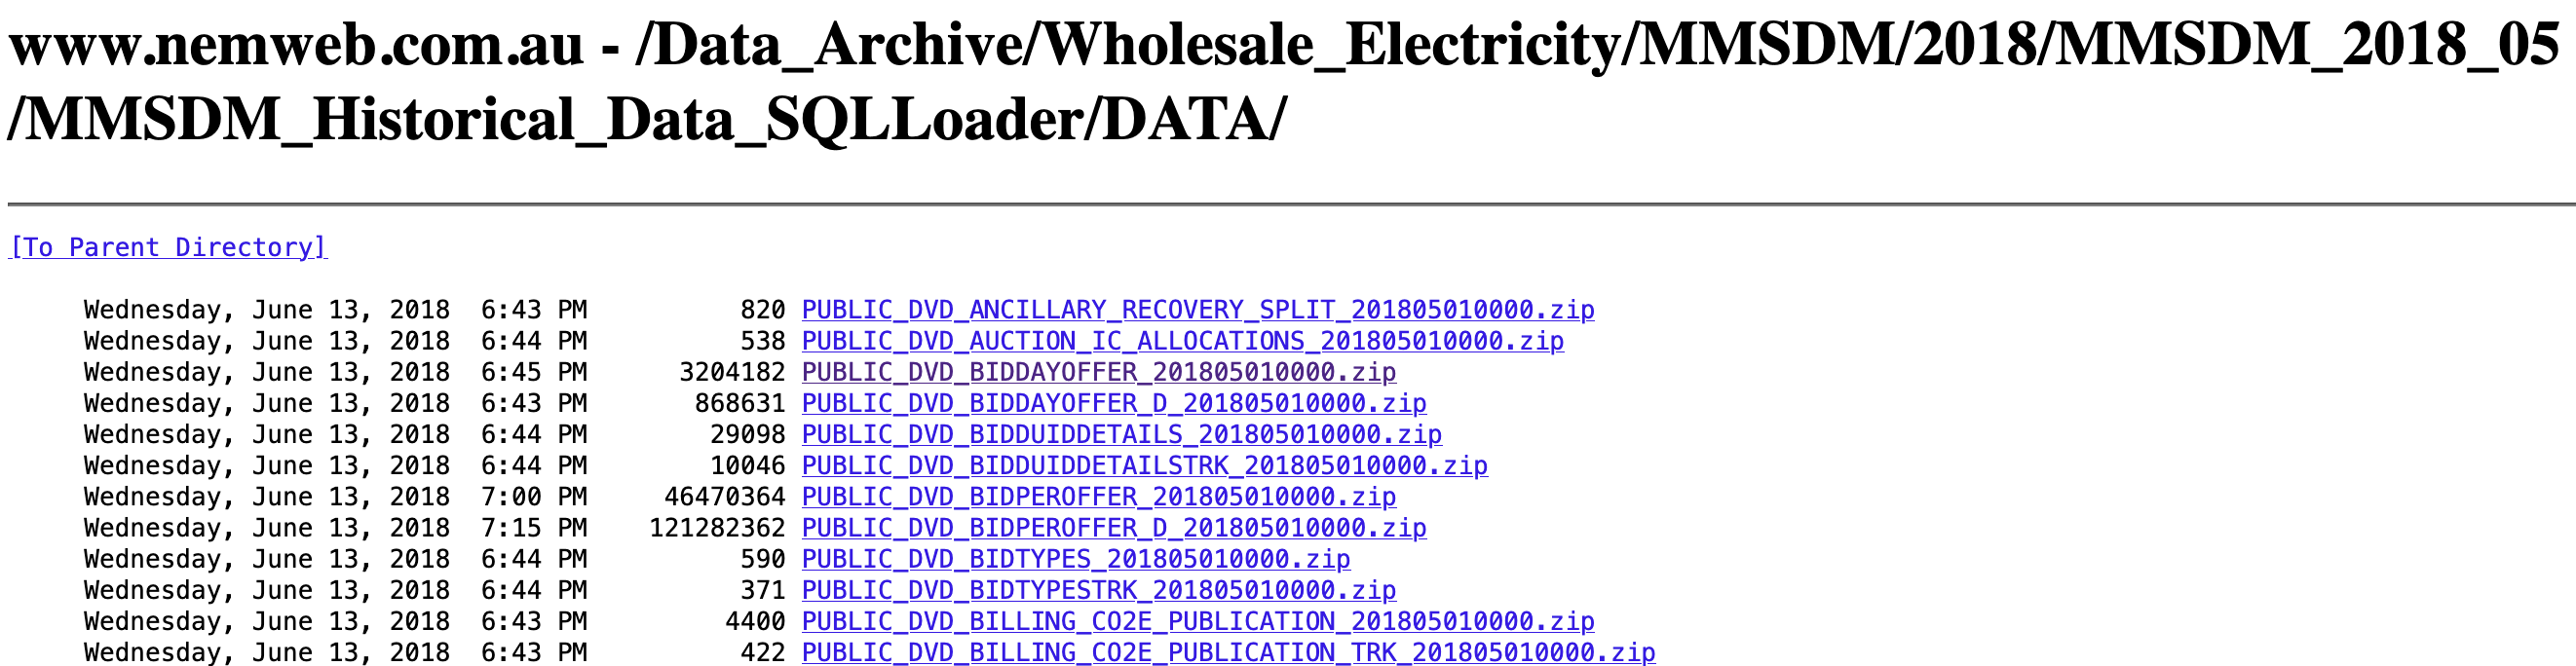
Data for each day is provided in a single ZIP file (NemPriceSetter_20220101_xml.zip), which contains many XML files:
# NemPriceSetter_20220101_xml/NEMPriceSetter_2022010100100.xml

<PriceSetting PeriodID="2022-01-01T04:05:00+10:00" RegionID="NSW1" Market="Energy" Price="87.69011" Unit="LBBG1" DispatchedMarket="R5RE" BandNo="6" Increase="1" RRNBandPrice="23.7" BandCost="23.7" />
<PriceSetting PeriodID="2022-01-01T04:05:00+10:00" RegionID="NSW1" Market="Energy" Price="87.69011" Unit="BW04" DispatchedMarket="R5RE" BandNo="1" Increase="-0.47368" RRNBandPrice="1" BandCost="-0.473684" />
<PriceSetting PeriodID="2022-01-01T04:05:00+10:00" RegionID="NSW1" Market="Energy" Price="87.69011" Unit="BW03" DispatchedMarket="R5RE" BandNo="1" Increase="-0.52632" RRNBandPrice="1" BandCost="-0.526316" />The MMSDM provides both actual data and forecasts for a range of variables - including prices, demand and electricity flows.
Data in the MMSDM is supplied from three different, overlapping sources:
Some report names can be different across sources - for example DISPATCH_SCADA versus UNIT_SCADA.
The settlement price in the NEM is known as the trading price - it is the price that matters for what generators get paid and what customers pay.
Historically (before October 2021) it was settled on a 30 minute basis, as the average of the six 5 minute dispatch prices for the same interval.
AEMO timestamp with the time at the end of the interval. This means that 01/01/2018 14:00 refers to the time period 01/01/2018 13:30 - 01/01/2018 14:00. This will be true for columns like SETTLEMENTDATE, which refer to an interval. Columns like LASTCHANGED, which refer to a single instant in time are not affected by this.
I prefer shifting the AEMO time stamp backwards by one step of the index frequency (i.e. 5 minutes). This allows the following to be true:
dispatch_prices.loc["01/01/2018 13:30":"01/01/2018 14:00"].mean() == trading_price.loc[
    "01/01/2018 13:30"
]
The shifting also allows easier alignment with external data sources such as weather, which is usually stamped with the timestamp at the beginning of the interval.
If the AEMO timestamp is not shifted, then the following is true:
dispatch_prices.loc["01/01/2018 13:35":"01/01/2018 14:05"].mean() == trading_price.loc[
    "01/01/2018 14:00"
]All examples below are for MMSDM May 2018:
A major benefit of the large & open dataset shared by AEMO is the ecosystem tools built on top of it.
A simple CLI for downloading NEMDE & MMSDM data - created & maintained by yours-truly:
$ pip install nem-data
$ nemdata --table trading-price --start 2020-01 --end 2020-12A Python package for downloading historical data published by the Australian Energy Market Operator (AEMO):
$ pip install nemosisUse in Python:
from nemosis import dynamic_data_compiler

start_time = "2017/01/01 00:00:00"
end_time = "2017/01/01 00:05:00"
table = "DISPATCHPRICE"
raw_data_cache = "C:/Users/your_data_storage"

price_data = dynamic_data_compiler(start_time, end_time, table, raw_data_cache)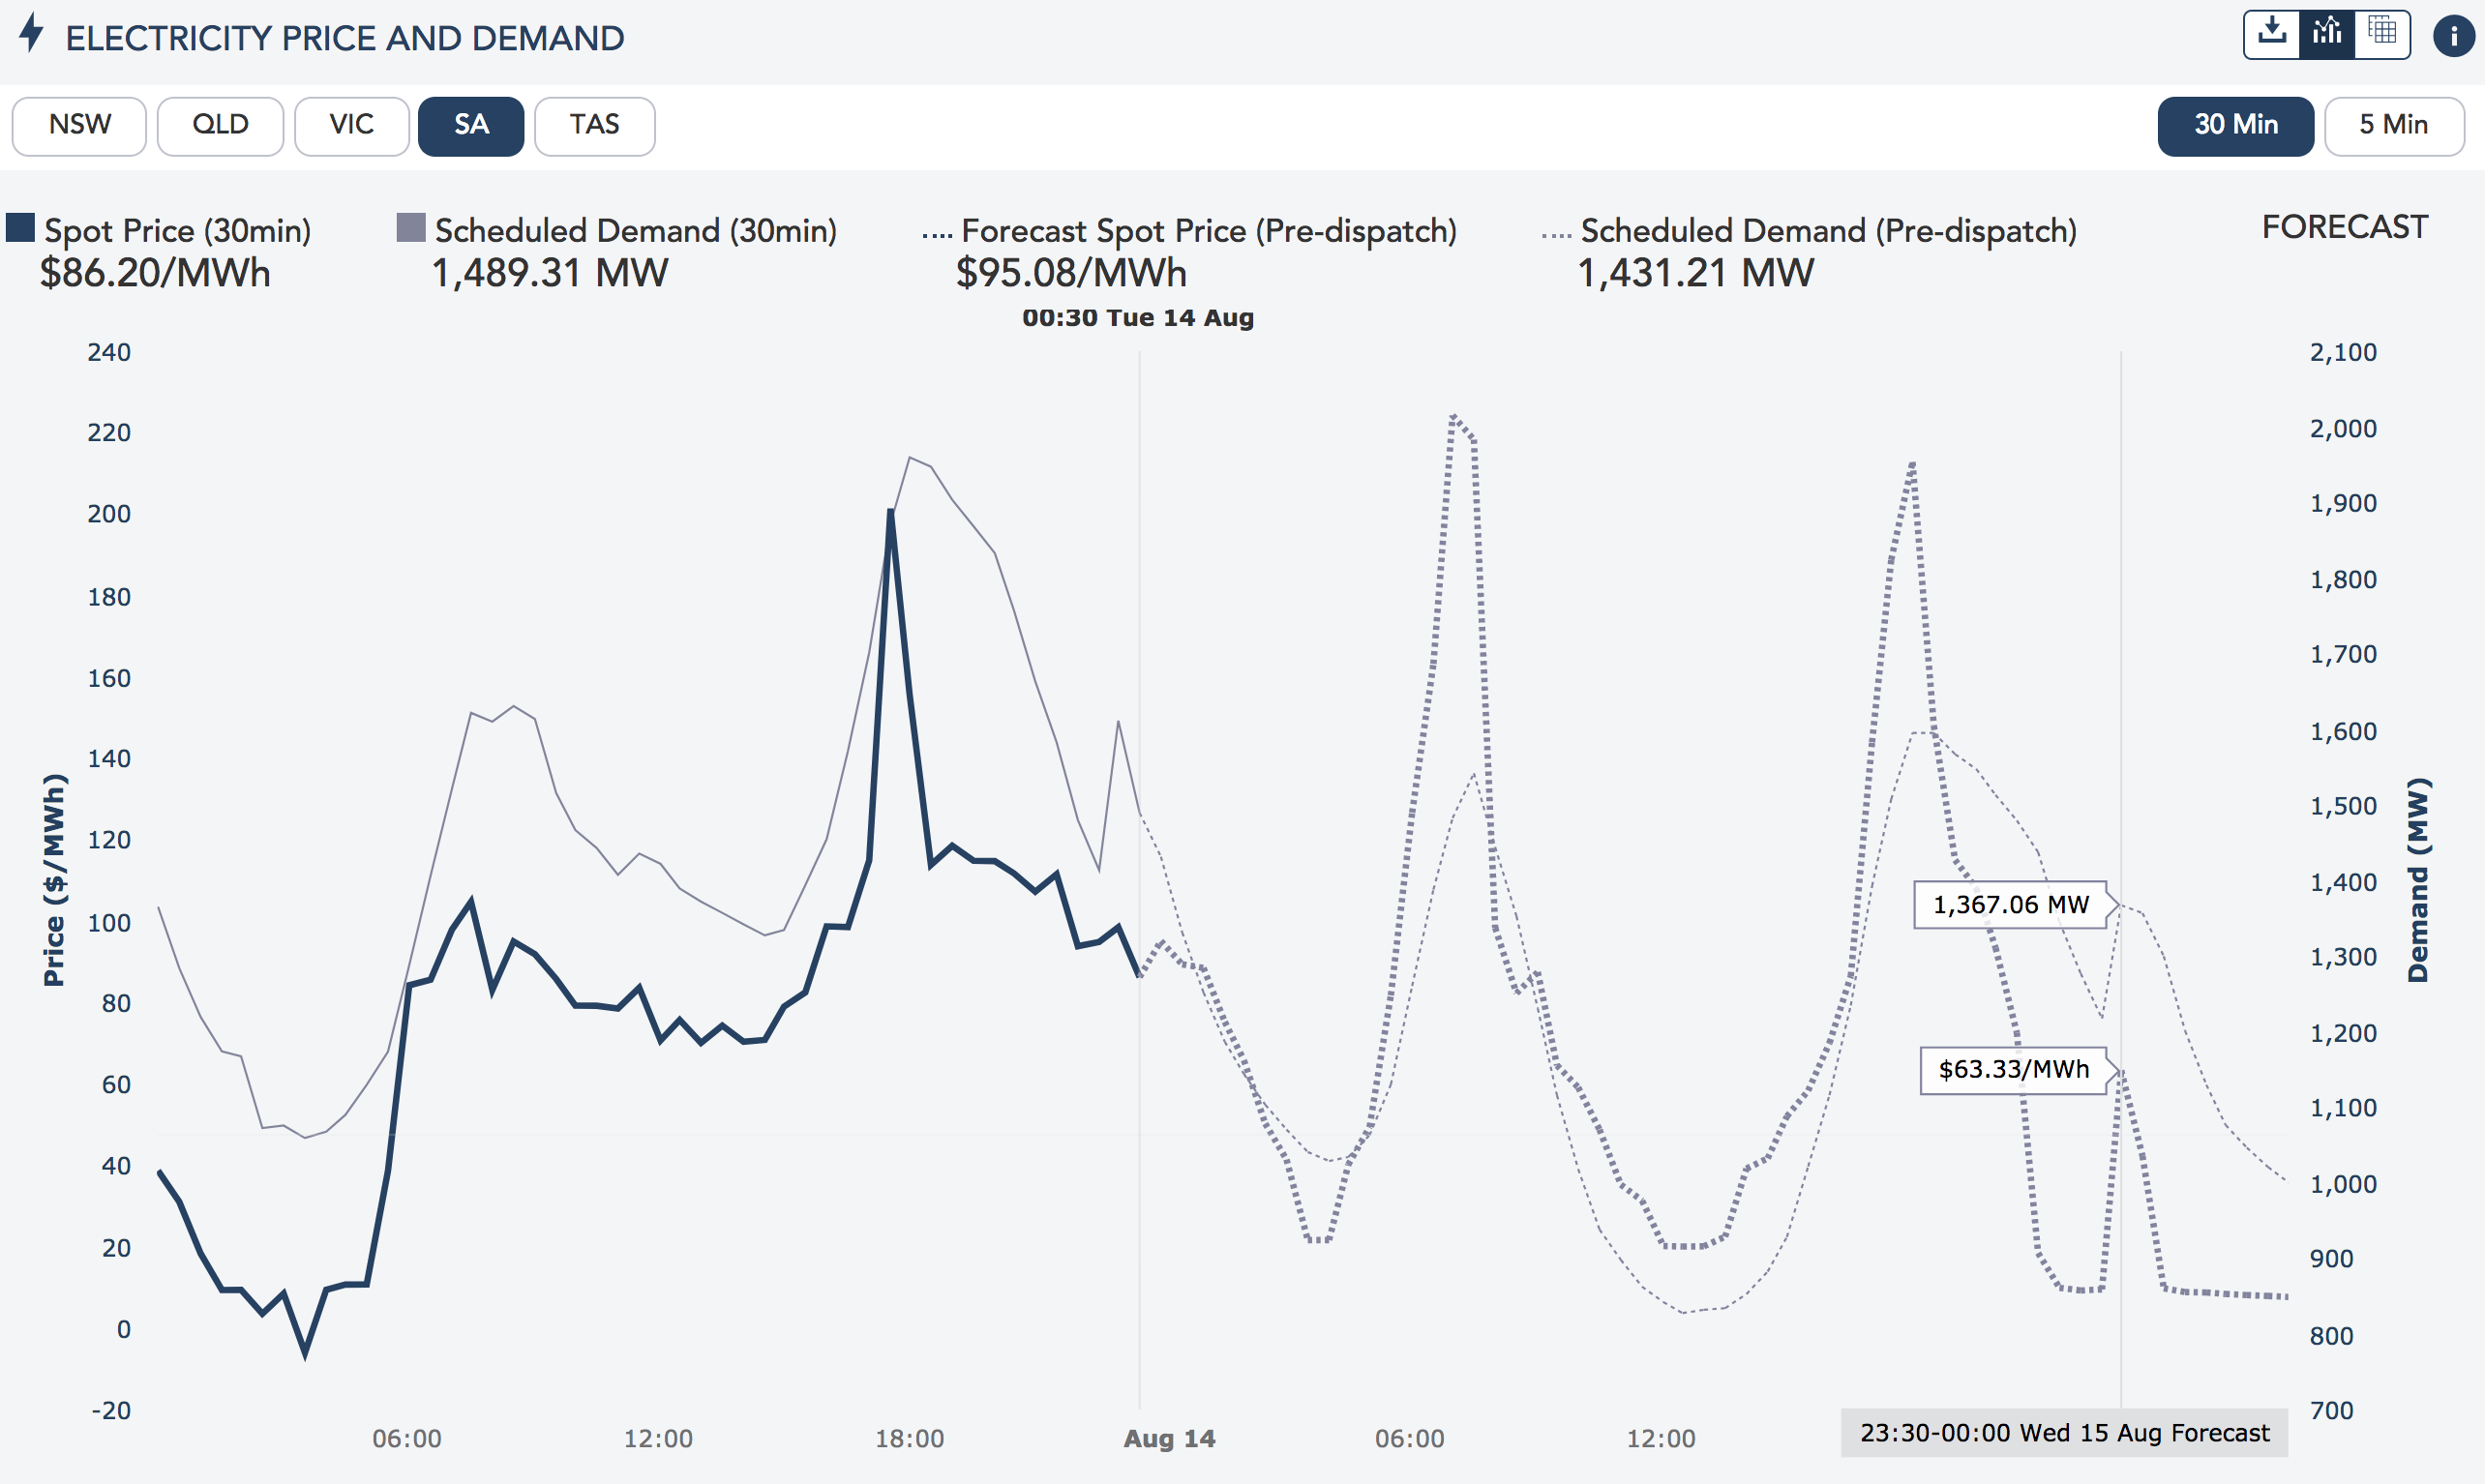
Thanks for reading!